Podium Image Editor - Updates
Several new tools were added to Podium Image Editor.
Summary of new features in Podium Image Editor:
White balance and overlay mask were integrated into the existing interface, while an Advanced tab was added to the PIE interface to accomodate Adaptive contrast and Curves.
White Balance
The white balance sliders are located at the bottom of the General tap and provide another way to perform global corrections on your image. A subtle hand is recommended.
Temperature - Shifts the color temperature of the image between warm (yellow/orange) at lower values and cool (cyan/blue) at higher values. Color temperature is based on the Kelvin scale.
Tint - Allows users to perform adjustments on the Green - Magenta spectrum. This offers a mechanism to offset an unwanted color cast in your render—for example, if you feel your render contains too much green, move the tint slider toward magenta.
Background Tab - Overlay and Mask
Overlay is a feature in the backgound tab which lets you load a second image over the top of your render—this is useful for adding a subtle line overlay to enhance the details in your image.
A new Mask function has been added to the Overlay feature. This button automatically generates a mask to remove the white background from a line overlay, leaving only the lines in the final image.
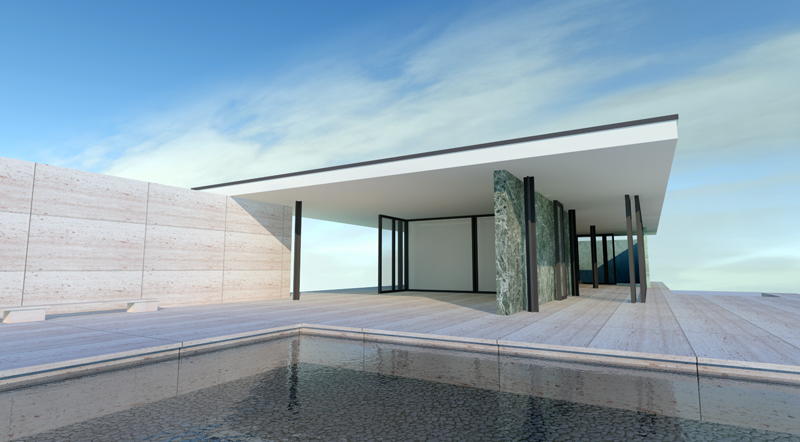
Base render from Podium.
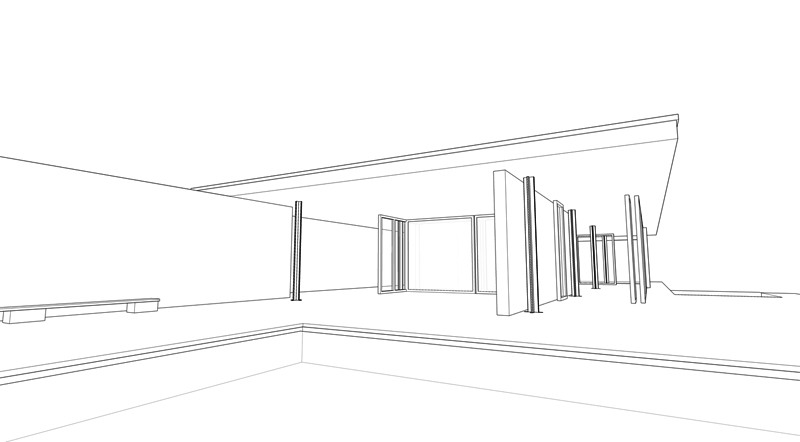
Hidden Line export from SketchUp.
How to use the Overlay/Mask feature:
- Create a Podium render. Switch to the Hidden line style and then use SketchUp's 2D export feature to generate a line-overlay. Note, the overlay must match the pixel resolution of your render exactly. Instructions on this here.
- Open your render in PIE, switch to the background tab.
- Click Load and navigate to the 2D line overlay. The overlay is loaded at 50% opacity—note the "washed out" effect in the white portions of the overaly.
- Mask - Click Mask to filter out the white portions of the overlay, and restore the render to its original tone/brightness.
- Fade - This is an opacity slider for the overlayed image—adjust the intensity of the line-overlay to your desired value.
- Darken and Smooth - These sliders allow users to fine-tune the overlay.
- Smooth applies a slight gaussian blur to the line overlay to counteract any jagged artifacts present in the mask.
- Darken multiplies the line-overlay effect for more emphasis.
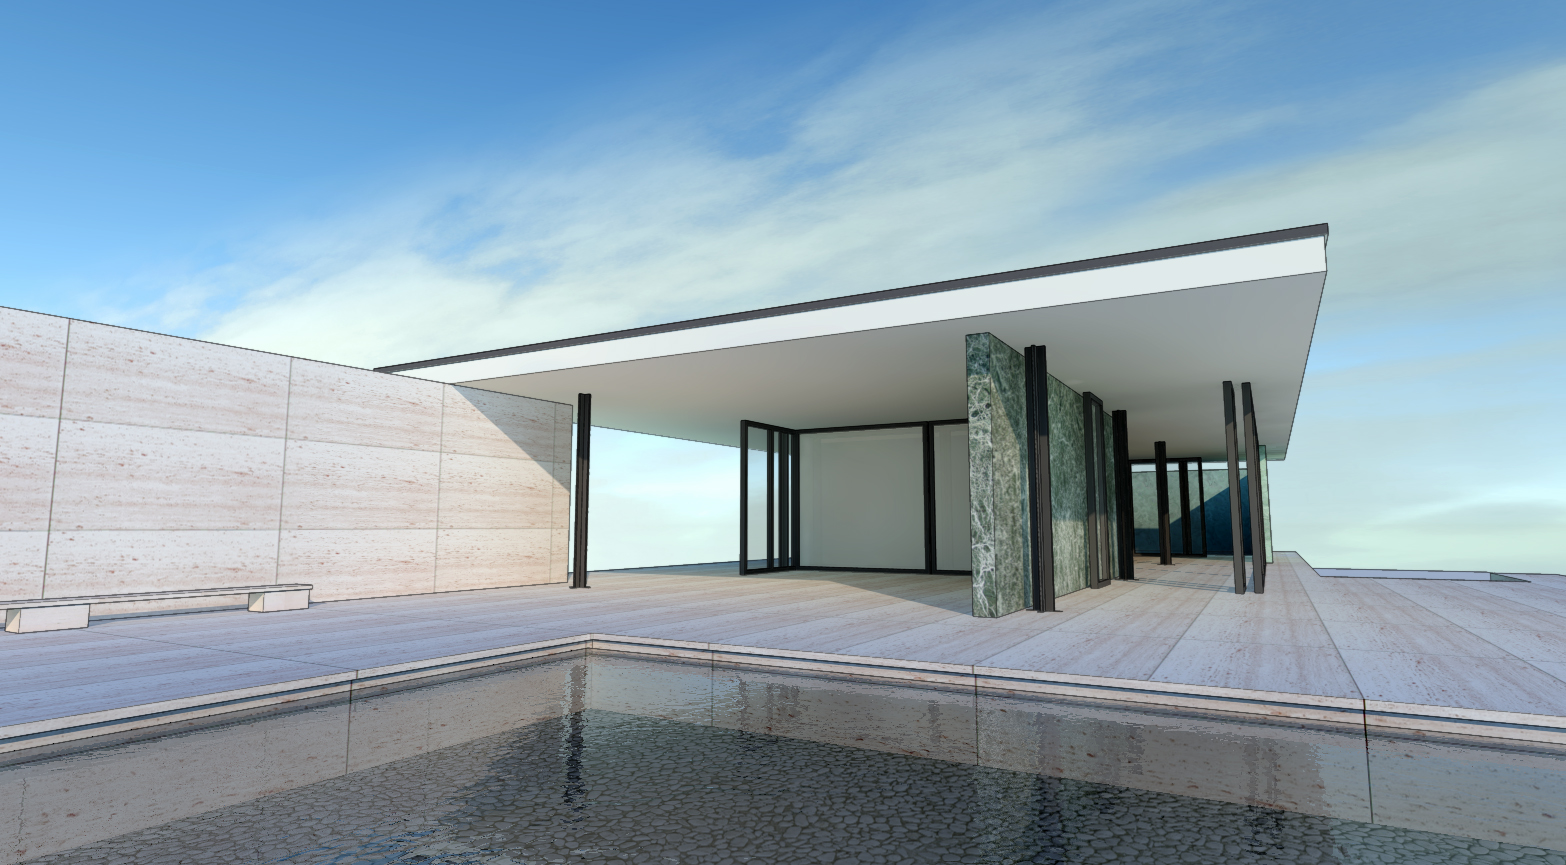
Final image with line overlay from PIE.
Curves
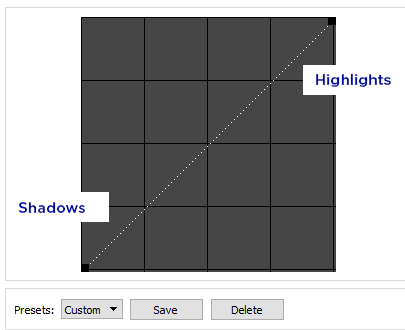
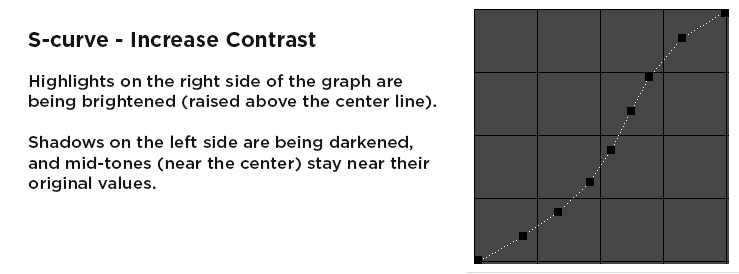
The curves tool (pictured below) is found in the Advanced Tab and gives users a more precise means to adjust brightness, contrast, and value distribution in an image. Unlike the simpler brightness/contrast slider, Curves allows you to target specific regions of a render based on the region of the graph you are manipulating.
How to interpret and manipulate the curve:
Everything left of the centerpoint corresponds to the parts of your image that are in shadow. The right side of the curve corresponds highlights. The Y-axis depicts luminance values for that region of the image.
Operate the tool by placing control points on the curve and dragging them up or down to brighten/darken that region.
1. Left click anywhere on the diagonal line to add a control point.
2. Drag a control point up or down to brighten or darken that region of the image. A control point on the left half of the graph will let you brighten or darken shadows in your image, and a control point on the right side lets you manipulate the highlights.
3. Right click on a control point to remove it from the graph. Clicking "cancel" removes all points from the graph.
4. Remember to click "apply" when you are happy with your adjustments. Changes are saved with the image until you click Apply.
Presets:
If you've created a curve that will be useful to you in the future, it can be saved as a preset by clicking Save just below the tool. Select a preset from the dropdown to load a curve, and click Apply to apply it to your image. Delete a preset by selecting it from the dropdown and clicking Delete.
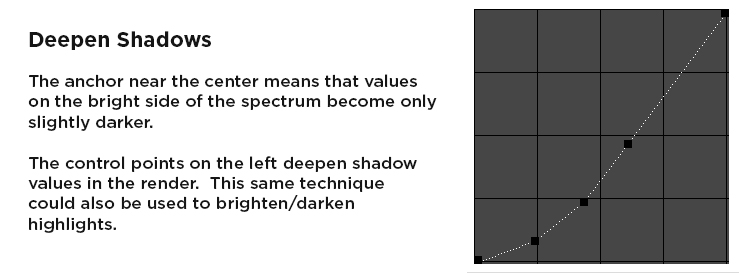
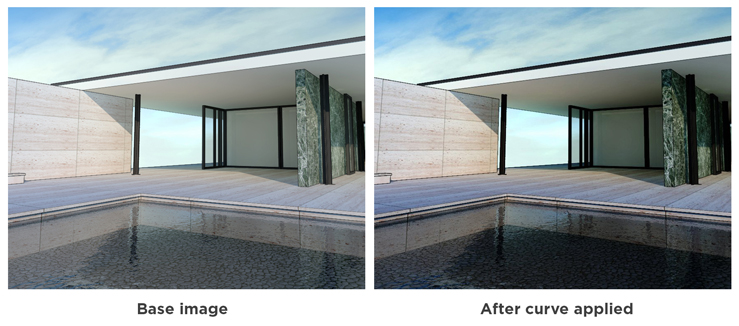
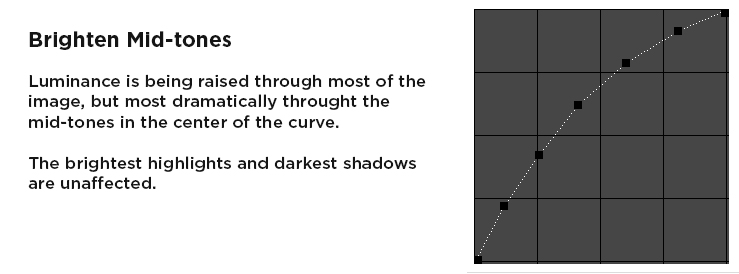
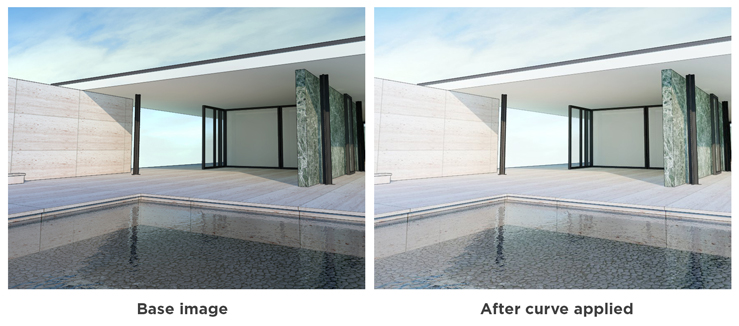
Example curves:
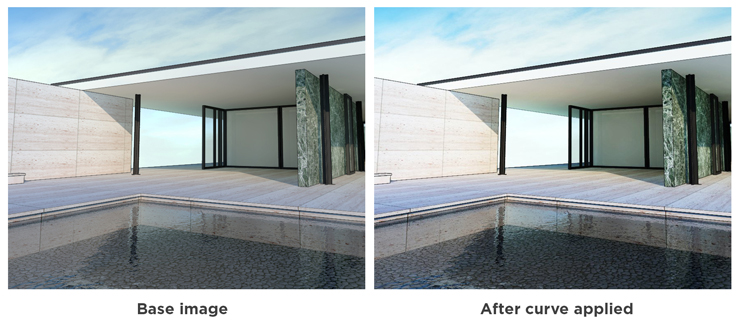
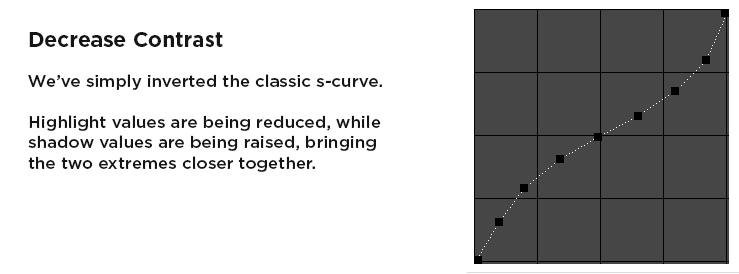
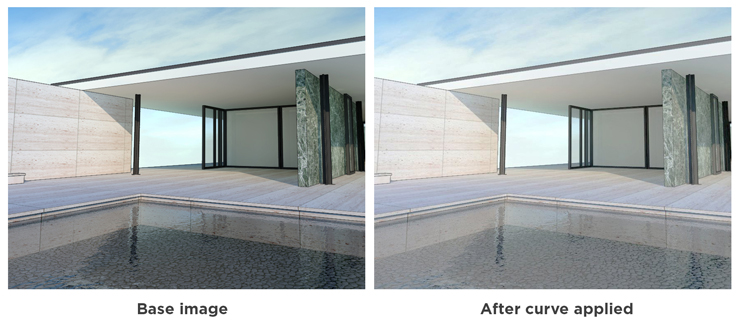
These four slides show some of the operations that can be completed with the curves tool.
Adaptive Contrast
Adaptive contrast is a tool in the Advanced tab, which uses adaptive histogram equalization (AHE) to improve contrast in a render.
Instead of applying a global contrast adjustment to the entire image, the adaptive method divides the image into regions/tiles and redistributes lightness values based on a unique histogram for each section. Therefore it is suitable for improving local contrast, improving local contrast and enhancing edge definition in each region of the render.
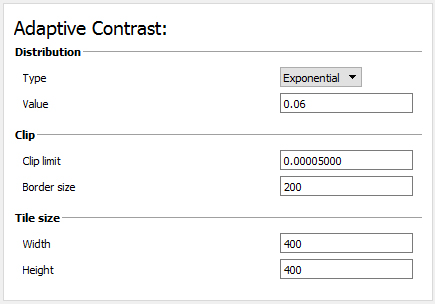
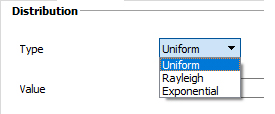
Distribution Type - There are three distribution types available, uniform, exponential, and rayleigh.
The difference between the distribution types is technical and fairly subtle; we recommend testing all three distributions to get a feel for how they transform your image. At default "clip limits" the rayleigh distributio tends to darken images considerably
Value - The value function in controls the overall strength of the effect when Exponential or Rayleigh is selected. A value between 0.01 and 1 is generally recommended.
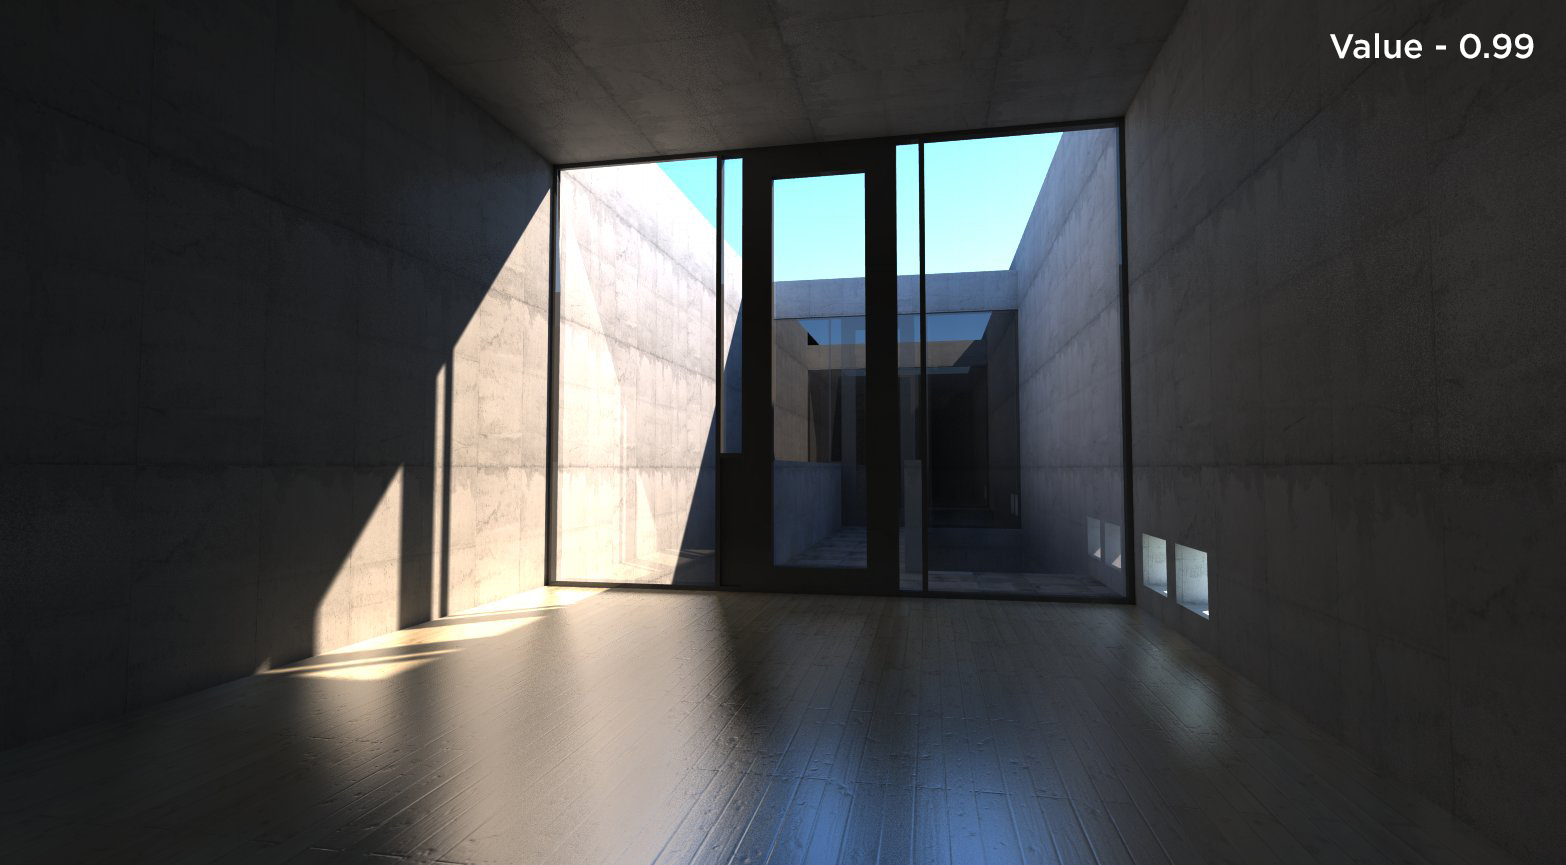
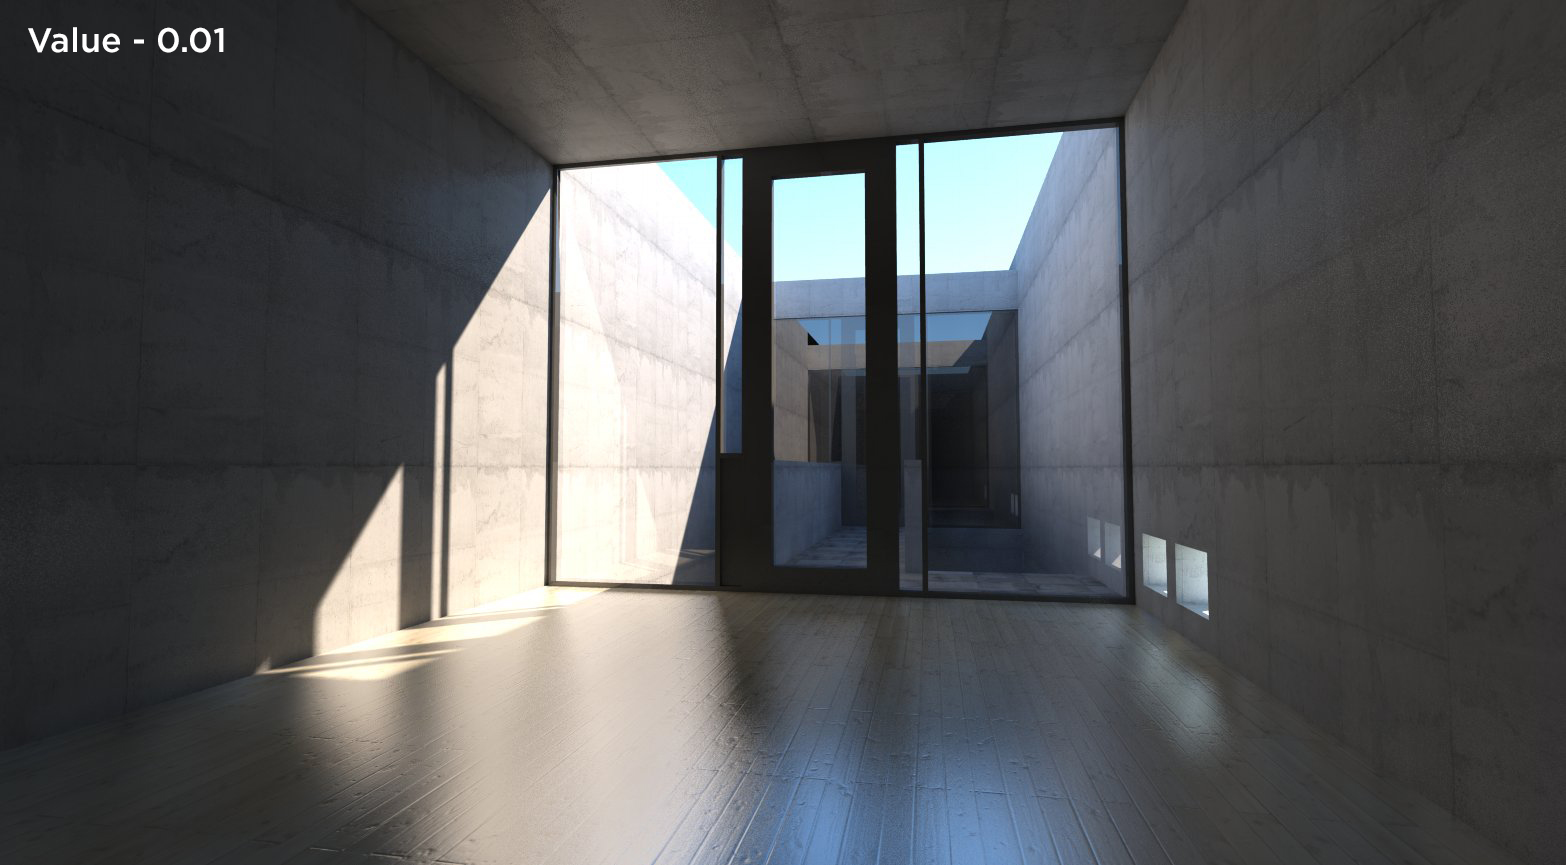
Value 0.06 (left) and Value 0.6 (right)
Clip limit - This function sets the clip limit to the histogram equalization remap. The smaller this value is, the less drastic are the effects of histogram equalization. The smaller values for the clip limit, prevents oversaturation in the output. The clip limit attempts to spread the histogram values uniformly across the histogram.
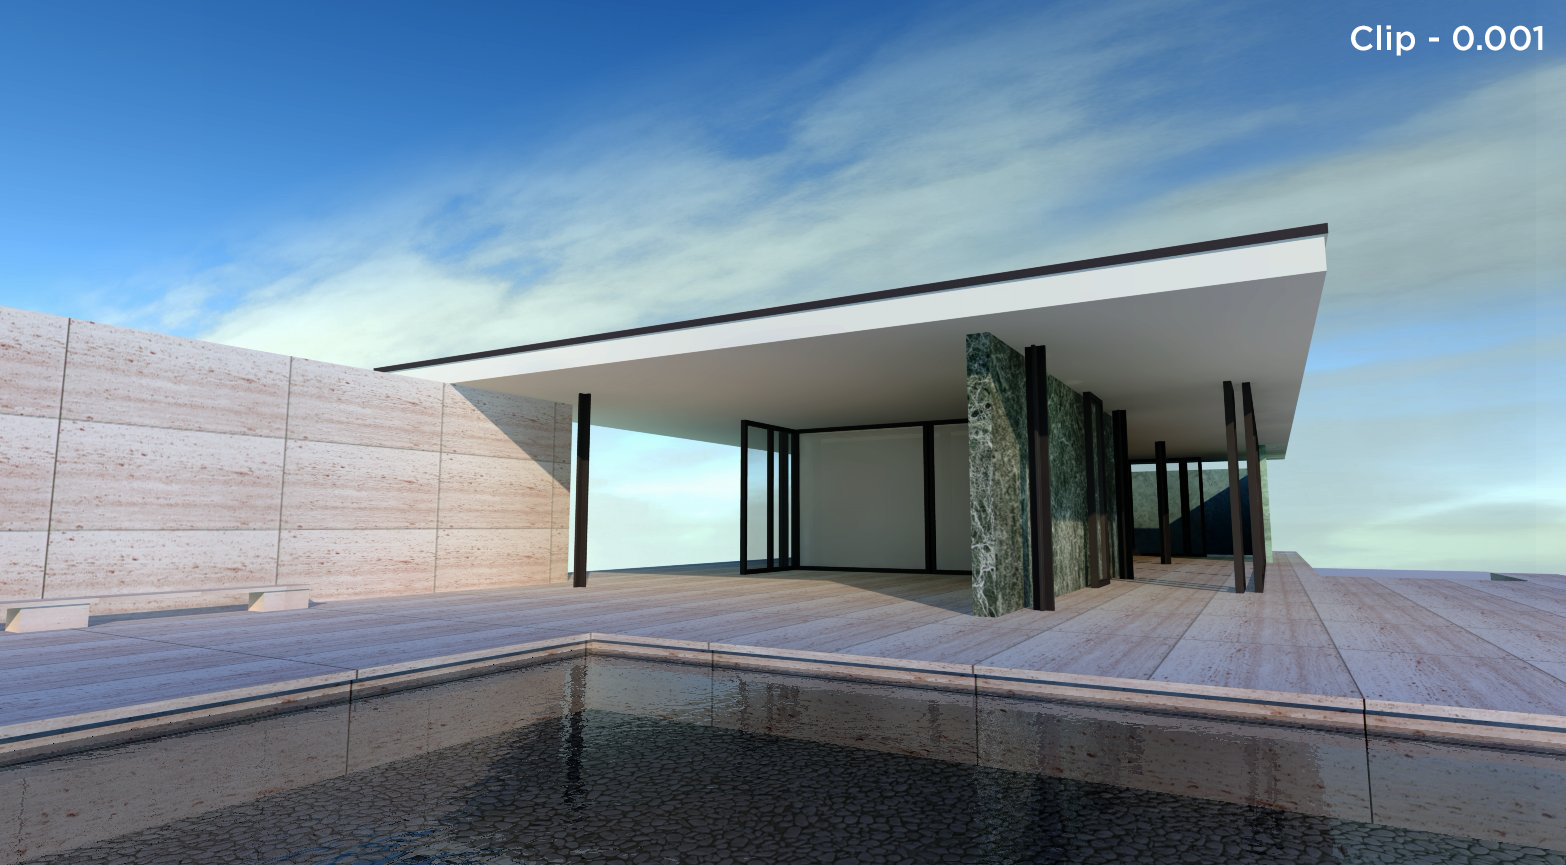
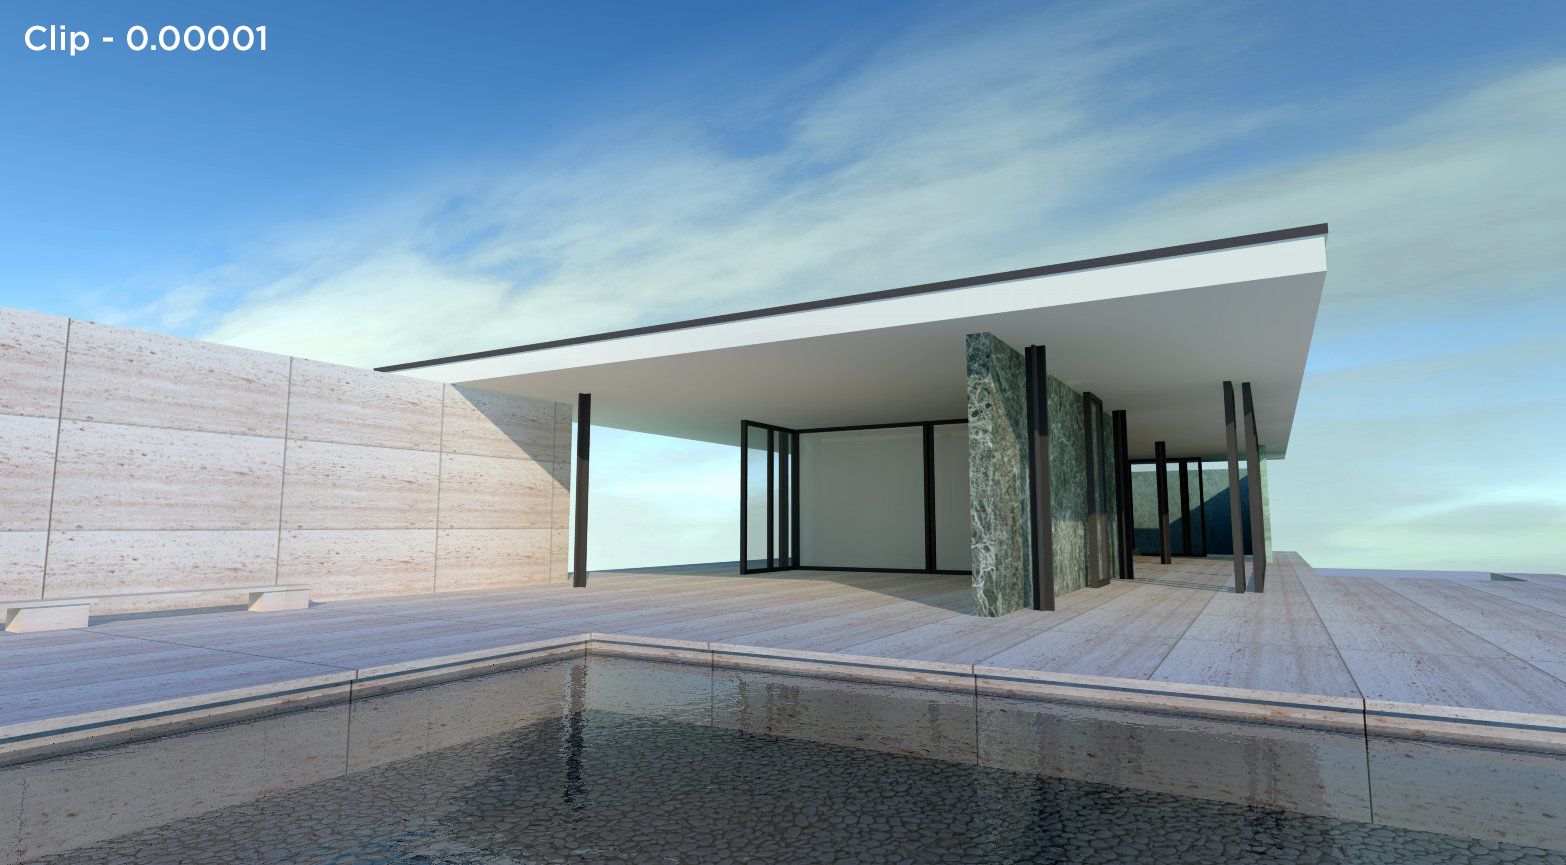
Value 0.06 (left) and Value 0.6 (right)
Tile size - Adaptive contrast divides the image into tiles and redistributes values based on "local" histogram values. The smaller the size, the longer it takes the algorithm to process the data and the more adaptive the histogram equalization becomes. For an image of 3000×4000 pixels, a size of 300×400 seems to be reasonable in terms of performance and quality of results.
Border size - This function sets the border size of tile overlap between tiles. Since the histogram equalization is based on local tiles, blocking artifacts can be noticed from tile to tile. Increasing the border size smooths boundaries between tiles and minimizes tile-to-tile artifacts.
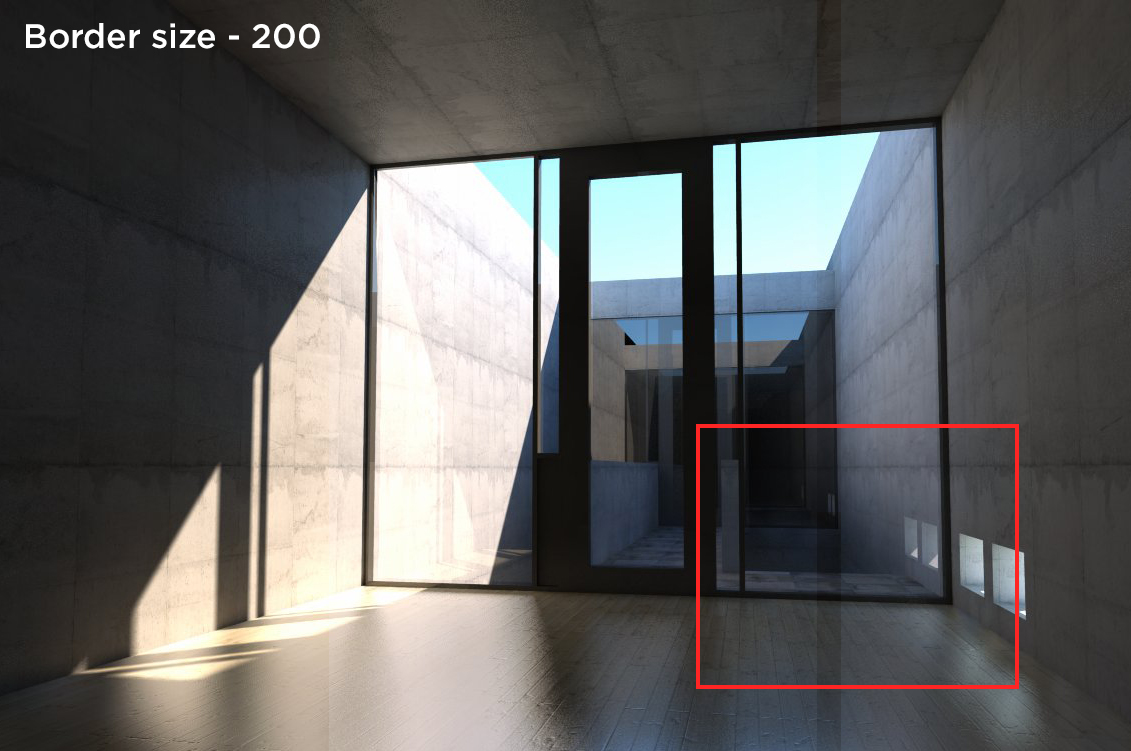
Tile artifacts visible at Border size 200.

Increasing border size smoothes tile boundaries.